
We worked in pairs and in small groups to write questions about what this cross section diagram was showing. We swapped our questions with others to see if they understood what the diagram was showing. We then wrote some questions about what information the diagram did not provide, therefore would require more research.
Below are some of our summaries we wrote about this diagram:
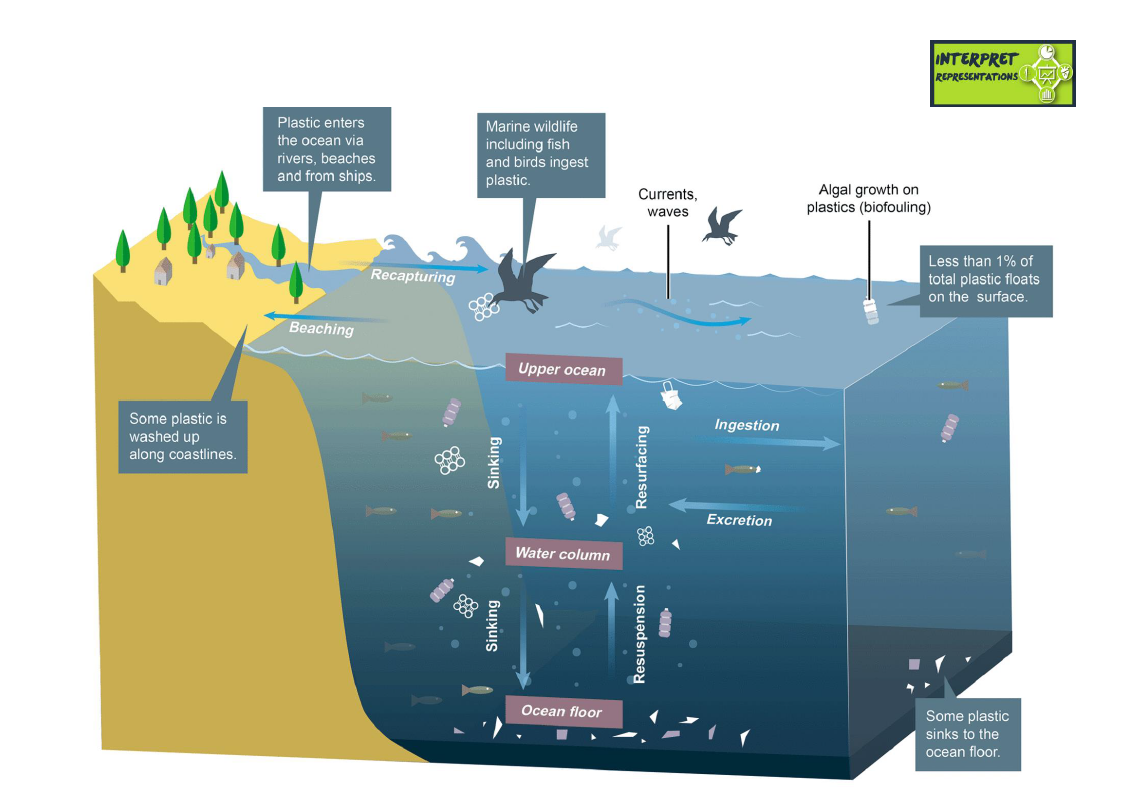
Briar, Beka, Amelia and Milla -This is a cross section diagram of the ocean and it is trying to tell us where it goes. On fact that it says is that less than 1% of total plastic ends up on the surface of the water. Some plastic is washed up on coastlines as it shows us. We know that animals ingest plastic and die because it told us and showed a picture of a bird eating plastic. It tells us what plastic sinks and what doesn’t. Some plastic ends up on the bottom all ripped up.
Annabel, Sophie L, Olivia and Ana -This diagram is a cross-section and shows us the cycle of plastic and how far plastic goes.It shows us where plastic flows from. Some facts about plastic, the 3D angle of the ocean and sand. It also shows us marine life and the cycle of how plastic sinks. This diagram shows different ways plastic kills animals and how much plastic is on the surface of the ocean. Some research statistic tells you that plastic is washed up along coastlines, how plastic enters into the ocean. About marine life, how much plastic is on the ocean surface, that some plastics sink to the bottom and kills most marine life.
Questions that we need more research for:
- How much plastic is in the ocean?
- How many habitats are plastic destroying?
Ashlee and the K/Calebs - This is a cross section showing how plastic gets into the ocean and what happens to it. This gives facts and good information about plastic and it shows what it does like if it floats or sinks.
It tells us that marine life eats the plastic. This is a very good factual cross section that was easy to use and help us with our learning.
Sophie M, Mikayla and Anna -
The diagram shows us of how the plastic ends up in the ocean and different ways of how it develops and of how the animals eat the plastic.
The heavier plastic is the one that ends up in the bottom of the ocean. This cross section shows us how the cycle of how it happens and where it ends up and of how the plastic resolves. This cross section also shows us how the marine life is dying.
It shows us different ways it could end up in the ocean.
Abbie, Ruby, Georgia and Brileigh -
This diagram shows the cycle of what plastic goes through in life. Our marine life is ingesting plastic and birds and fish are getting endangered. It shows how plastic sinks and resurfaces by the current of the water. We have discussed our questions and answers and now know clearly why this is happening. This cross section shows us the disadvantages of plastic in our world.
Is it heavy plastic that sinks to the bottom of the ocean?
How much plastic do the marine animals eat?
Lila, Rielli, Emily and Maggie -
This diagram shows how plastic is transferred in the ocean.It also shows how deep plastic can go.It shows that allsorts of plastics can move far away from were they wet originally like boardwalks rivers beaches.
Questions
- How does plastic biograde?
- Why does less that 1% float on the ocean surface?
George, Jay and Christian -
This diagram shows many facts about our oceans and the plastic in them. It shows the life cycle of plastic in the ocean, and what happens when it enters the water. It uses scientific words about what is happening and how it is affecting our seas. It is in 3-D and contains facts, and also what happens when plastic waste makes its way into the ocean.
Treat researching guys. That diagram shows how much rubbish we use and end up in the ocean. Very interesting.
ReplyDelete